At BAKERSFIELD AP, CA US, the lowest monthly mean temperature normal is 49.2°F in December, and the highest is 84.8°F in July. These are 1991–2020 station averages, not daily extremes or conditions measured at your Bakersfield building. [1][2]
LOCAL FIELD GUIDE // Central Valley
Bakersfield, CA: cooling trends versus air-quality assumptions.
An HVAC planning brief for Bakersfield, CA teams working on cooling trends versus air-quality assumptions, with a cited seasonal reference, a practical evidence checklist, and clear limits on what is known.
For a Bakersfield controls review, pair cooling complaints with outdoor temperature, occupancy, and actual unit trends. If outdoor-air quality is part of the concern, request a separate, current air-quality and ventilation review instead of using temperature data to justify changing outdoor-air operation.
Jurisdiction: Bakersfield, CA. The station below supplies regional climate context only; parcel authority, utility territory, and local-policy applicability remain to be confirmed.
Local-policy review pending. This public planning brief includes sourced context and a usable checklist, but does not establish local requirements. Confirm current rules with the responsible authority before acting.
SEASONAL REFERENCE // NOAA STATION DATAA seasonal reference.
A seasonal reference.
Not a sizing rule.
Use this record to frame operating questions for Bakersfield, CA, not to select equipment or predict the next season. It describes one regional station, not every neighborhood or building.
BAKERSFIELD AP, CA US
Station USW00023155
35.4344°, -119.0542°
Period: 1991–2020. Retrieved . Mean temperature is in °F; HDD65 and CDD65 are monthly heating and cooling degree-day normals using a 65°F base.
Inspect the station source [1]| Month | Mean °F | HDD65 | CDD65 |
|---|---|---|---|
| Jan | 49.5, Representative normal, 22 years used | 480.8, Representative normal, 22 years used | 0.3, Representative normal, 22 years used |
| Feb | 53.8, Representative normal, 22 years used | 315.6, Representative normal, 22 years used | 0.6, Representative normal, 22 years used |
| Mar | 58.6, Representative normal, 22 years used | 211.2, Representative normal, 22 years used | 12.7, Representative normal, 22 years used |
| Apr | 63.3, Representative normal, 22 years used | 113.0, Representative normal, 22 years used | 62.1, Representative normal, 22 years used |
| May | 71.1, Representative normal, 22 years used | 26.3, Representative normal, 22 years used | 213.8, Representative normal, 22 years used |
| Jun | 78.7, Representative normal, 22 years used | 2.0, Representative normal, 22 years used | 413.0, Representative normal, 22 years used |
| Jul | 84.8, Representative normal, 22 years used | 0.0, Representative normal, 22 years used | 613.7, Representative normal, 22 years used |
| Aug | 83.4, Representative normal, 21 years used | 0.0, Representative normal, 21 years used | 571.9, Representative normal, 21 years used |
| Sep | 78.2, Representative normal, 21 years used | 1.4, Representative normal, 21 years used | 397.3, Representative normal, 21 years used |
| Oct | 67.7, Representative normal, 22 years used | 49.1, Representative normal, 22 years used | 132.8, Representative normal, 22 years used |
| Nov | 56.3, Representative normal, 22 years used | 268.8, Representative normal, 22 years used | 6.4, Representative normal, 22 years used |
| Dec | 49.2, Representative normal, 22 years used | 489.7, Representative normal, 22 years used | 0.1, Representative normal, 22 years used |
Source completeness: Representative (R); 21–22 years used across the displayed values. NOAA may fill missing months from nearby stations according to the stated quality class. Read the field definitions [3].
We reproduce the published monthly fields directly. No building load, annual energy consumption, forecast, humidity measurement, or local-policy conclusion is calculated from this table.
01 // PUBLIC-SOURCE FACTS
What the available evidence supports.
Source statements, not a determination about your building. Regional climate and national methods are identified separately from local-policy evidence.
The station’s highest monthly heating degree-day normal is 489.7 in December; its highest cooling degree-day normal is 613.7 in July. Both use a 65°F base. Degree days describe outdoor temperature departures, not equipment capacity, energy cost, or indoor comfort. [1][3]
EPA describes benchmarking as comparing a building’s energy use with past consumption, similar buildings, or a reference performance level. This building-level context is different from identifying a failed asset or confirming a city reporting requirement. [4]
02 // OPERATOR CHECKLIST
Turn context into an evidence record.
Our planning synthesis. These steps are not additional city requirements.
Build a BAS and controls handoff- Define one decision for Bakersfield, CA: cooling trends versus air-quality assumptions. Record the actual property address, business impact, decision owner, and what evidence would change the next action.
- Export current schedules, sequences, point definitions, and override history with units and timestamps. Preserve the baseline before authorized changes are made.
- Align occupant complaints with outdoor conditions and equipment command/status trends. Have the qualified controls reviewer distinguish missing data from a demonstrated fault.
- Define the intended operating behavior and a verification method before approving a change. Retain approved sequences and acceptance results, not only screenshots of a dashboard.
- Use the December and July station reference periods to frame seasonal questions. Compare actual utility periods and on-site records; do not substitute the normals table for measured site weather or design conditions.
- Deliver this working record: A controls evidence packet with separate temperature, indoor-air-quality, operating-schedule, and qualified-review questions. Assign a named owner and a due date to every unresolved item; leave unsupported conclusions explicitly open.
TAKEAWAY // THE RECORD TO LEAVE WITH
A controls evidence packet with separate temperature, indoor-air-quality, operating-schedule, and qualified-review questions.
Minimum fields: asset or property ID, observation, dated source or attachment, open question, accountable person, next decision, and due date. This is a suggested working record—not a city-issued form.
03 // DIRECT ANSWERS
Questions before the next decision.
What can the Bakersfield climate table tell an HVAC operator?
It shows the seasonal pattern at BAKERSFIELD AP, CA US, using NOAA’s 1991–2020 normals. It can help choose contrasting periods for an operating review. It cannot establish current weather, extremes, humidity, indoor conditions, a building load, or the correct equipment size. Use site measurements and qualified design work for those decisions. [1][2]
What evidence should the Bakersfield team prepare first?
A controls evidence packet with separate temperature, indoor-air-quality, operating-schedule, and qualified-review questions. This is our recommended planning artifact, not a municipal form. Pair it with the bills and basic building information needed for a building-level benchmark, then identify the technical and authority questions that the benchmark cannot answer. [4]
Does this brief establish Bakersfield, CA reporting rules or incentive eligibility?
No. The airport normals contain no smoke, particulate, humidity, or indoor-air-quality measurements. The sources here support regional climate context and national benchmarking methods only. Obtain the current local or state document and an account- or property-specific response before acting on a threshold, deadline, exemption, permit, or incentive. Local-policy review remains pending; this public brief is planning guidance, not a determination of applicability. [1][4]
04 // SOURCE & SCOPE REGISTER
Inspect the sources.
Reference content checked 2026-10-06. Sources support only the stated scope; availability does not prove accuracy or site applicability.
No source below is presented as a reviewed municipal requirement, utility approval, or site inspection.
- BAKERSFIELD AP, CA US — 1991–2020 monthly normals (CSV) NOAA National Centers for Environmental Information · regional climate source
The 12 monthly mean temperatures and base-65°F heating and cooling degree-day normals for station USW00023155. This is a station reference, not a building measurement or local-policy source.
Content checked 2026-10-06 - U.S. Climate Normals: meaning, period, and limitations NOAA National Centers for Environmental Information · national source
The 30-year normal period, station-based methodology, and distinction between typical conditions and a forecast. Does not establish equipment sizing or municipal requirements.
Content checked 2026-10-06 - Normals CSV field definitions and quality flags NOAA National Centers for Environmental Information · national source
MLY-TAVG-NORMAL, base-65°F MLY-HTDD-NORMAL and MLY-CLDD-NORMAL, data-completeness flags, and years used. Values are read directly, not divided by ten.
Content checked 2026-10-06 - Benchmark your building with Portfolio Manager U.S. Environmental Protection Agency · ENERGY STAR · national source
Benchmarking compares building energy use with past consumption, similar buildings, or a reference. The tool’s national capabilities do not establish a local reporting obligation or diagnose an HVAC asset.
Content checked 2026-10-06
ONE PROPERTY. ONE USEFUL NEXT STEP.
Start a Bakersfield briefing Bring the local constraint.
Request an operating-readiness conversation for Bakersfield. We assess fit first; a city guide is not a promise of on-site delivery.
VISUAL FIELD GUIDE // 10 SYSTEM VIEWS
HVAC in focus.
A guide for Bakersfield, CA teams.
See the equipment, workflows, and records behind an operating-readiness assessment. Use these examples to ask better questions about your own building.
AI-generated educational illustrations shared across our city guides. These are not photographs of local buildings, Slyyyde projects, clients, or staff. Equipment shown may not be present at your site; illustrations are not installation instructions.
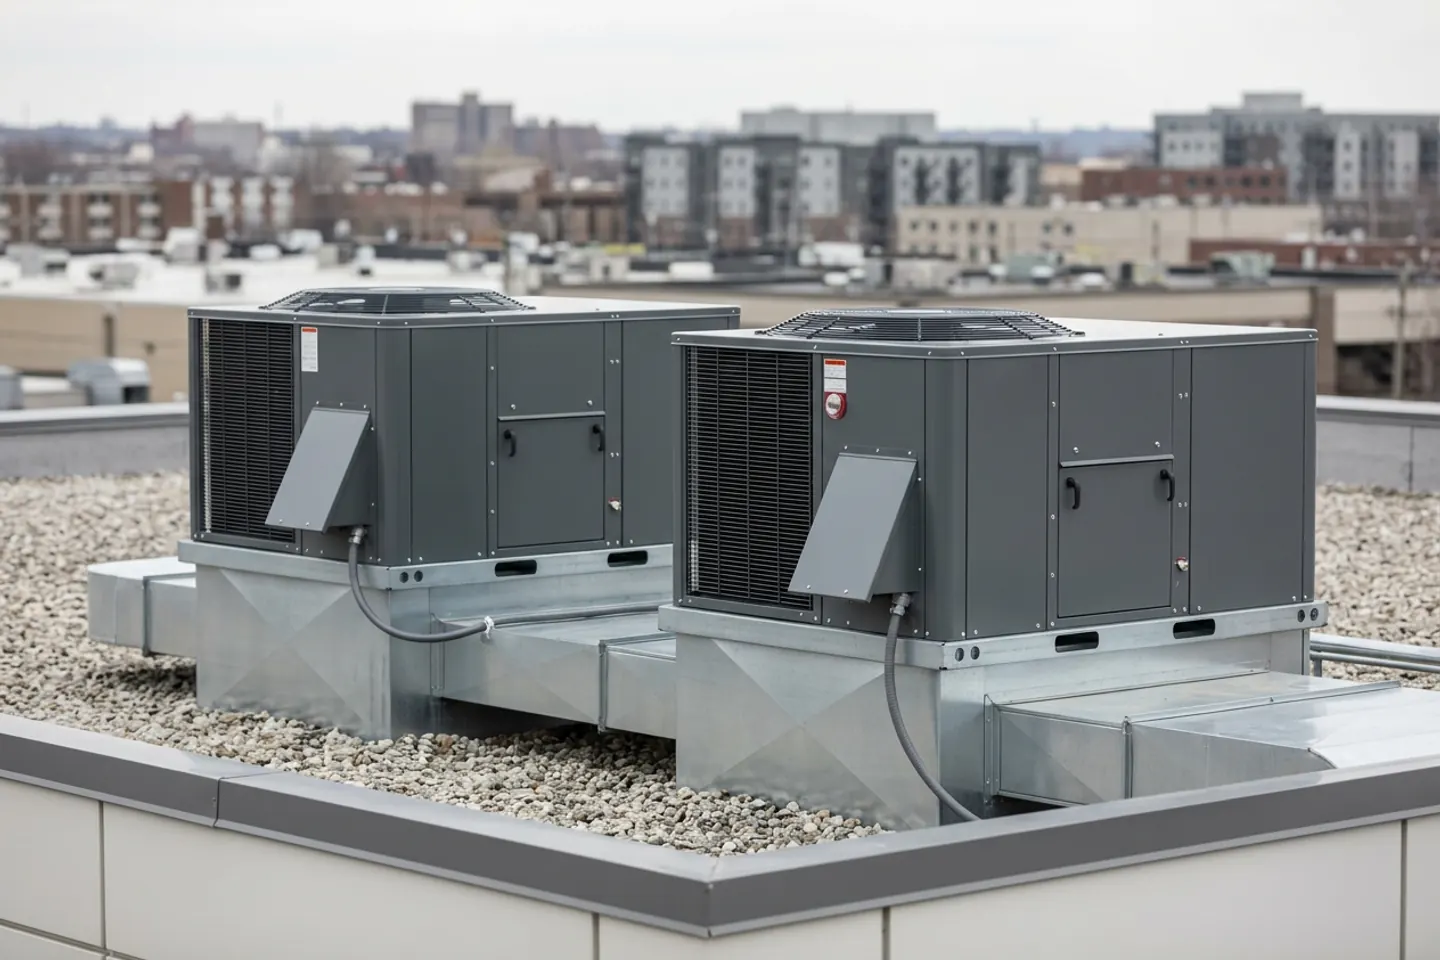
01 / Asset inventory
Rooftop equipment
Match each rooftop unit to an asset ID, nameplate record, service history, and the spaces it serves before planning repair or replacement.
RECORD TO COLLECTAsset register + service history
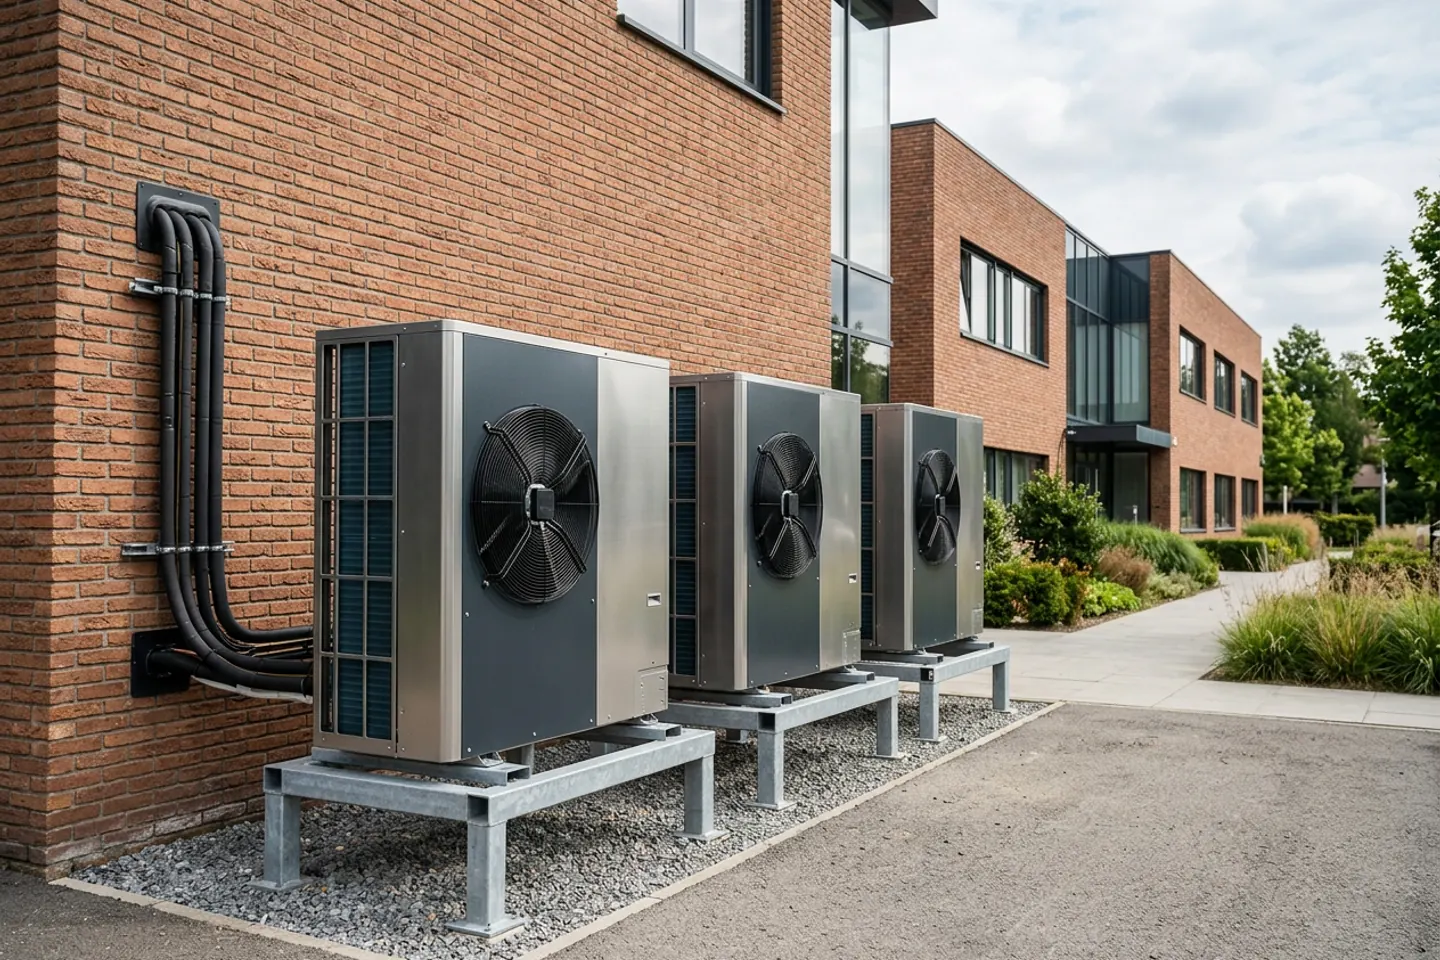
02 / Replacement planning
Commercial heat pumps
A heat-pump proposal needs building-load information, electrical capacity, operating-temperature requirements, and a qualified design review—not just an equipment quote.
RECORD TO COLLECTLoad assessment + electrical review
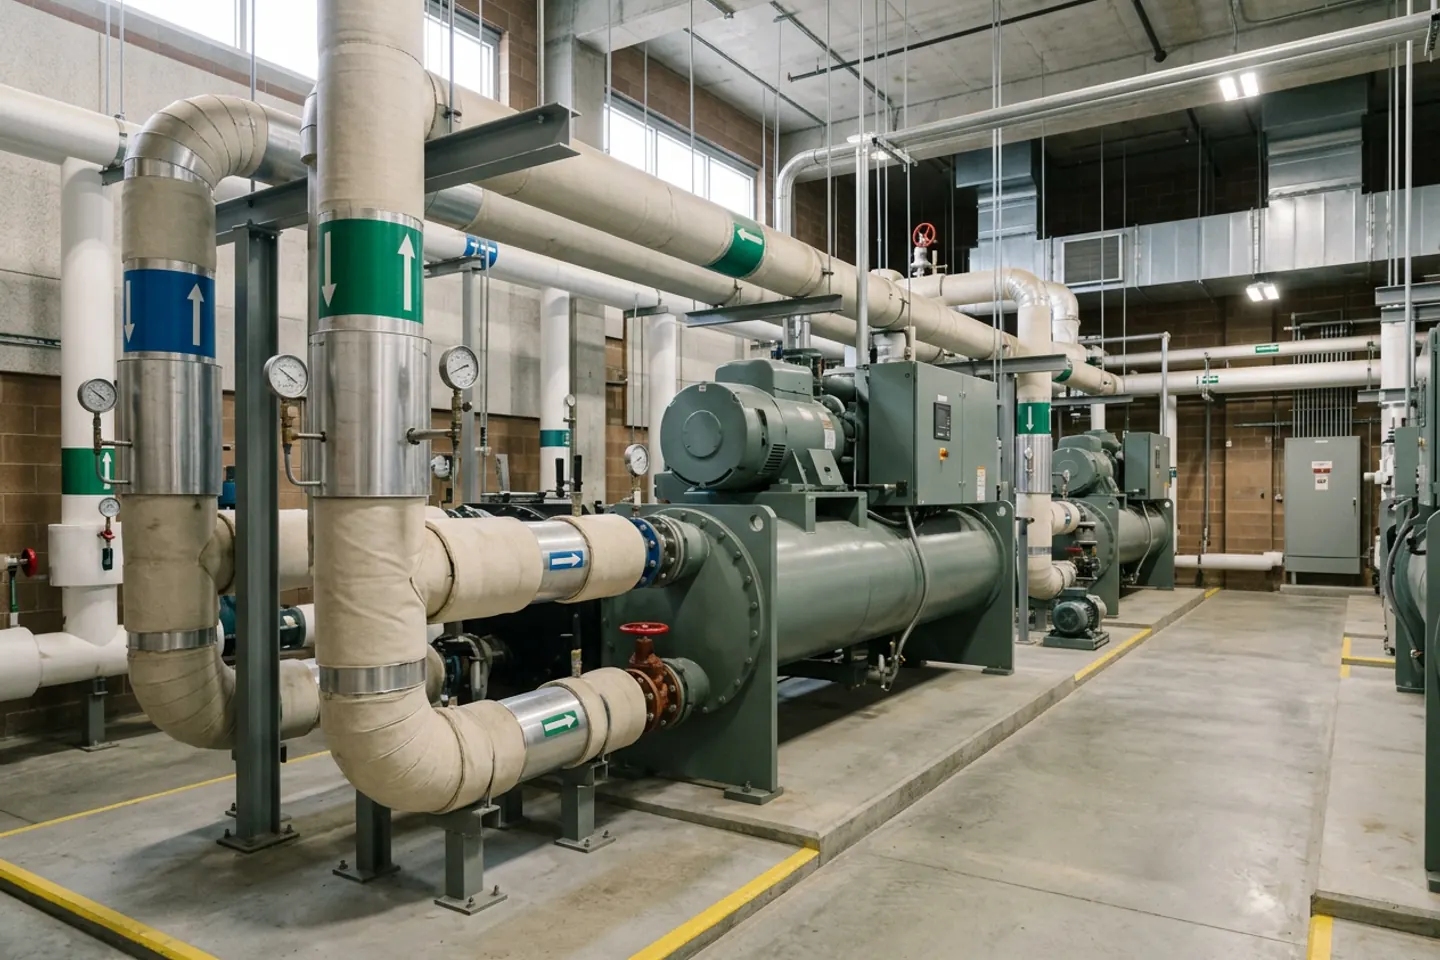
03 / System performance
Central cooling plants
Review plant schedules, water-temperature trends, alarms, and service records together. A single reading does not establish seasonal performance or savings.
RECORD TO COLLECTTrend logs + operating schedules
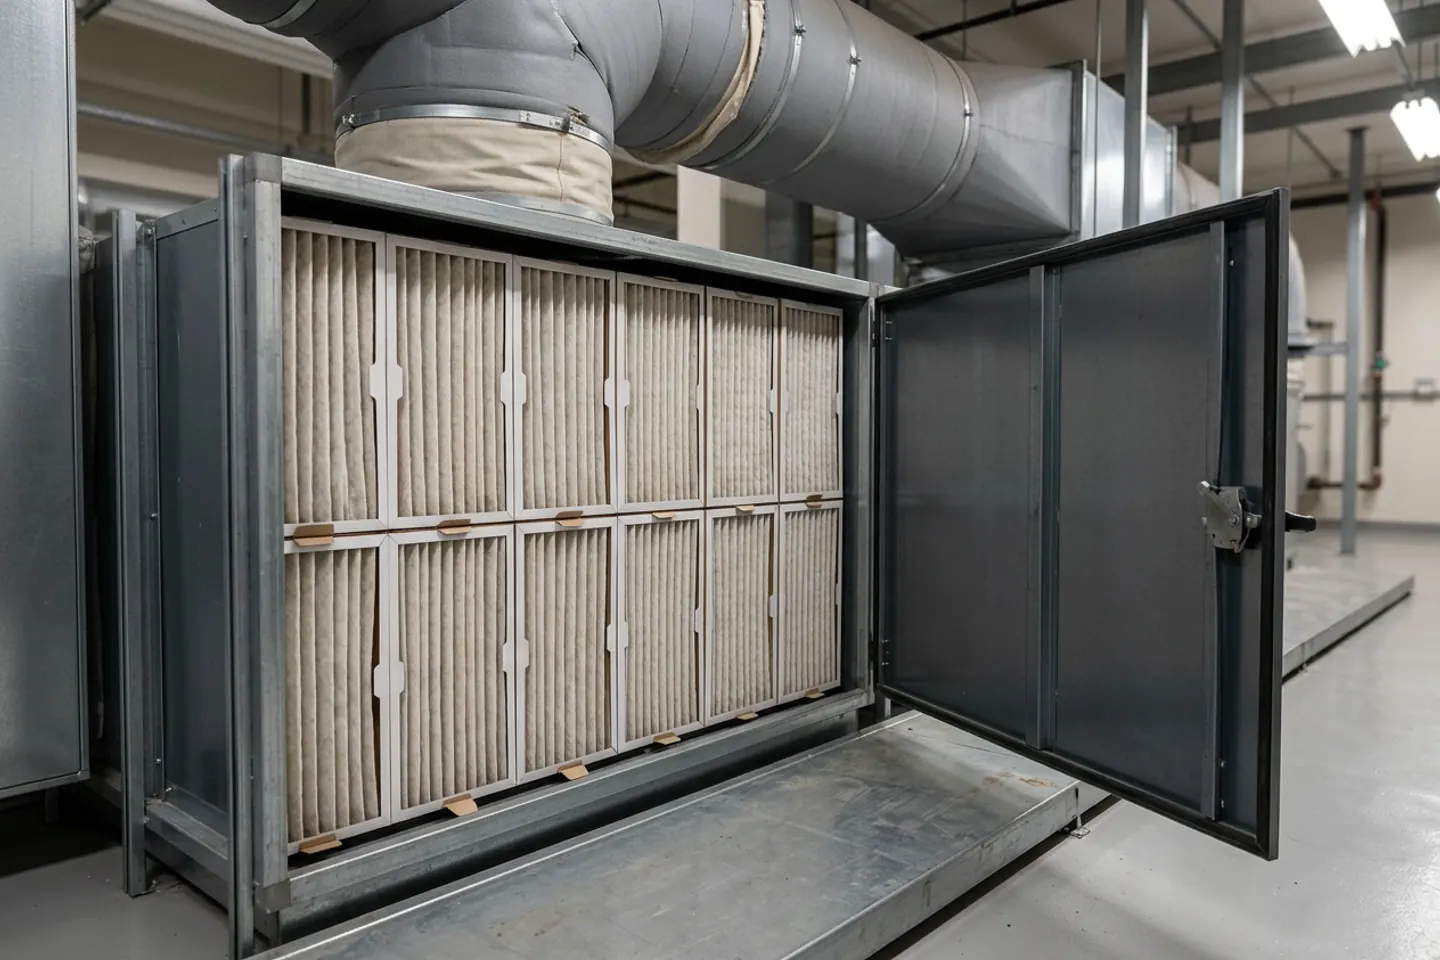
04 / Maintenance readiness
Air handling & filtration
Document the specified filters, replacement dates, access needs, and pressure readings where available. Filter appearance alone is not an indoor-air-quality assessment.
RECORD TO COLLECTFilter specification + maintenance log
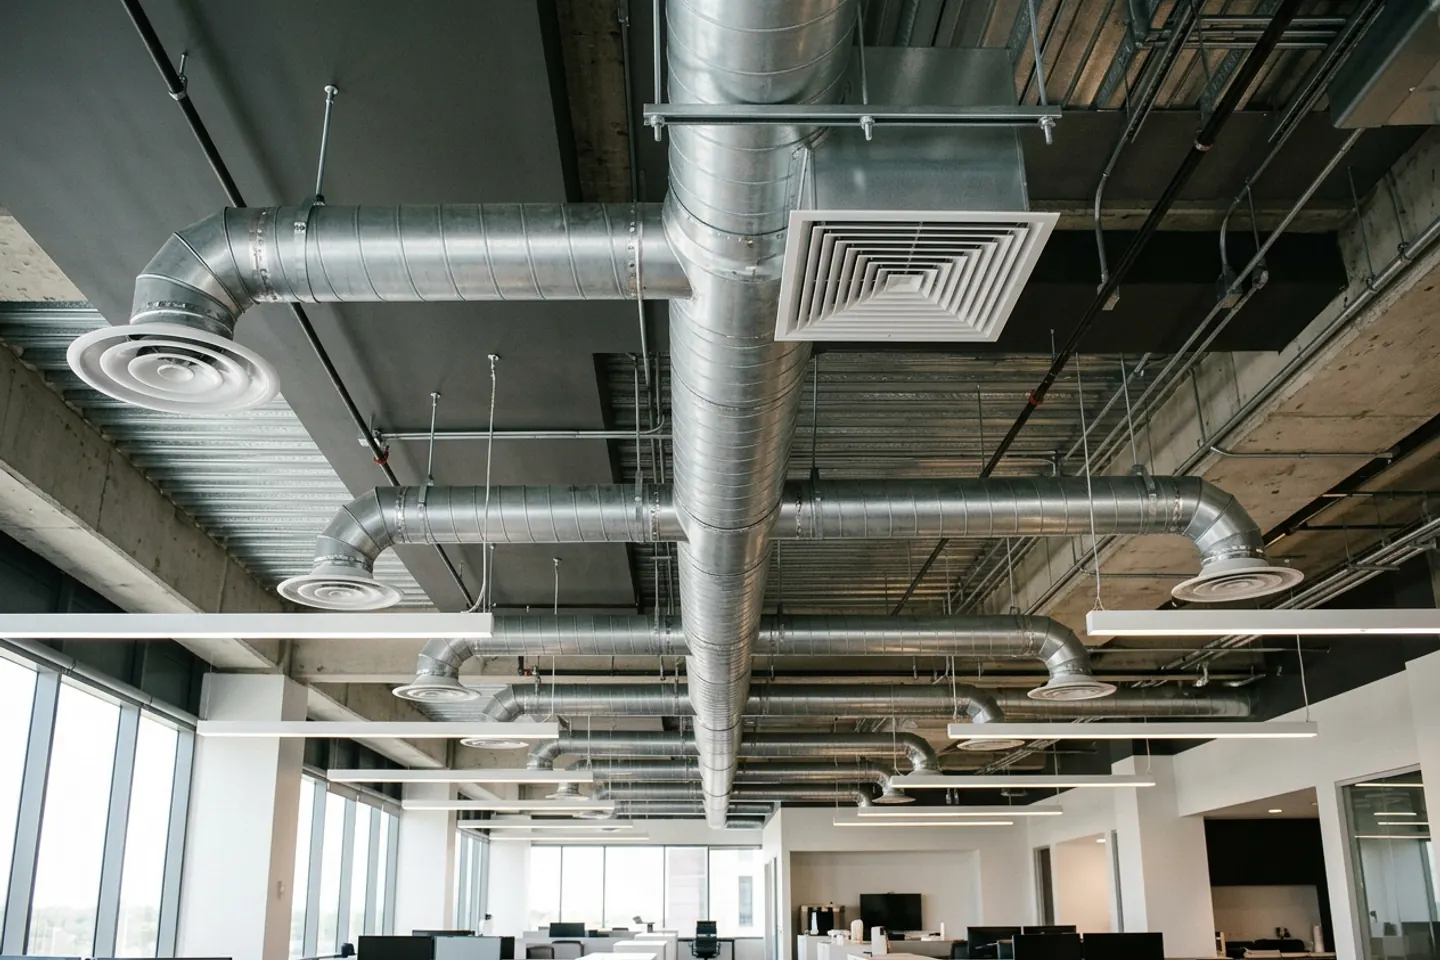
05 / Occupant comfort
Ventilation & distribution
Connect comfort complaints to zones, occupancy schedules, and available airflow records. Have qualified professionals evaluate ventilation and distribution changes.
RECORD TO COLLECTZone map + airflow records
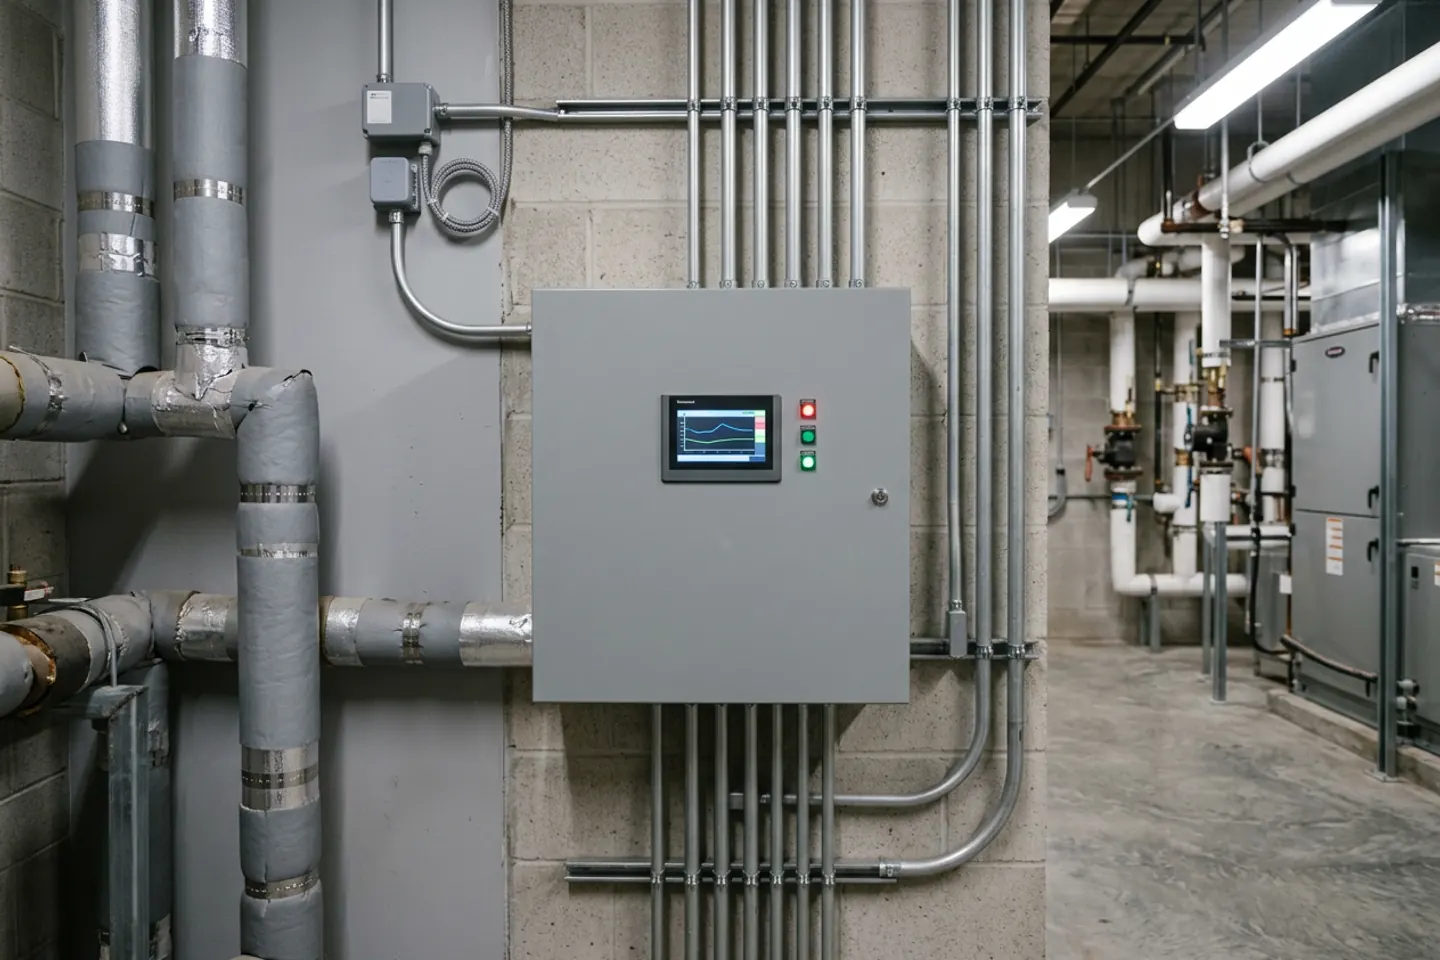
06 / Controls handoff
Building automation
Collect the point list, sequences, alarm history, and trend exports. Establish who can change settings and how those changes are recorded and reviewed.
RECORD TO COLLECTPoint list + sequence of operations
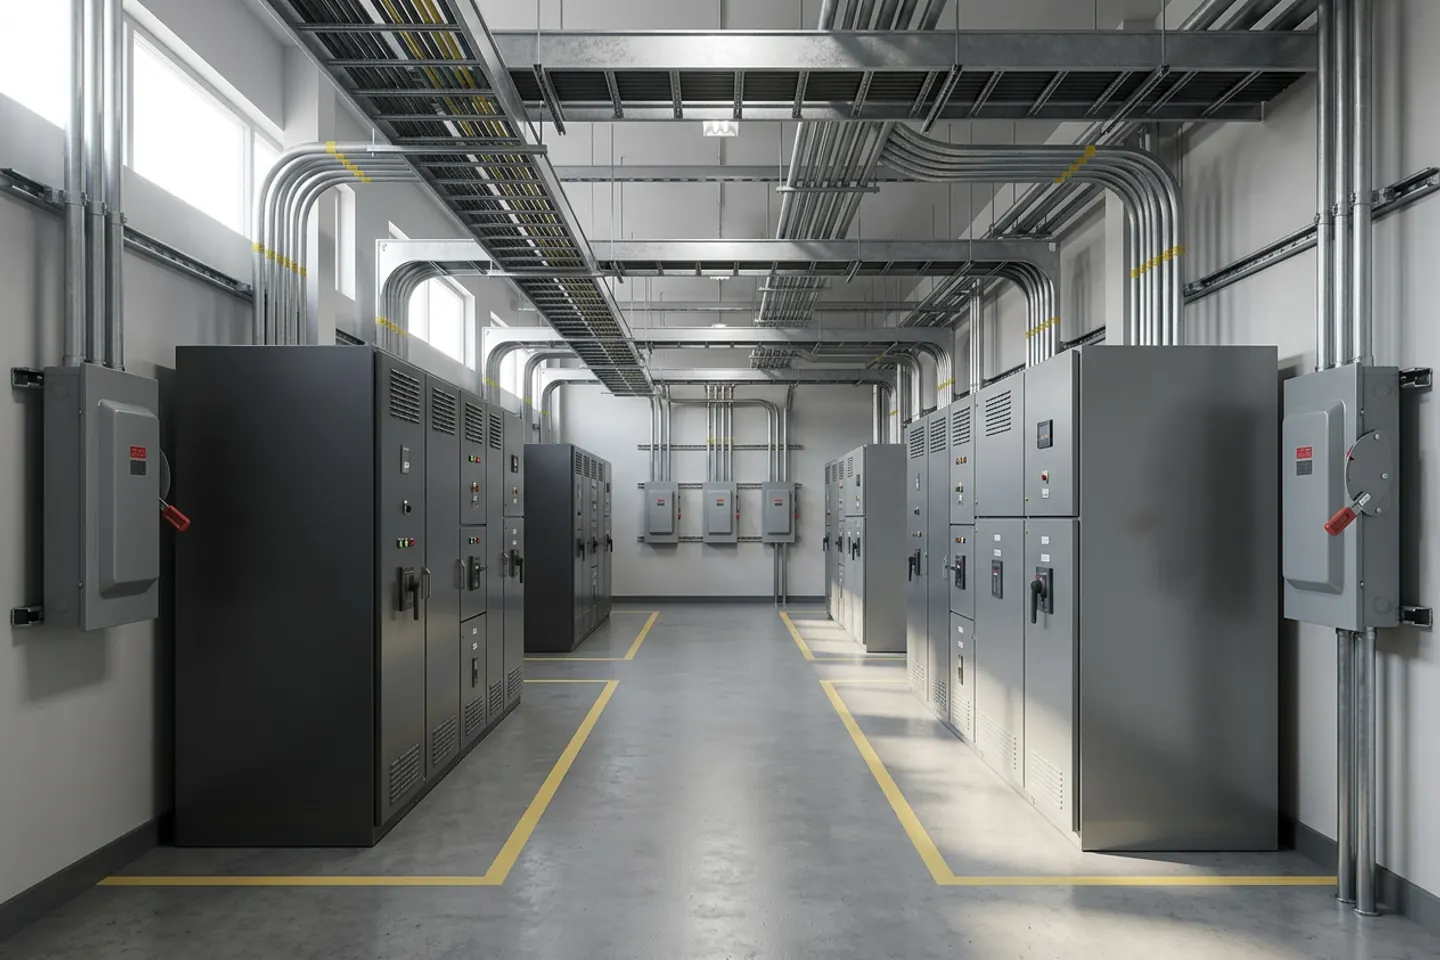
07 / Project dependencies
Electrical readiness
Route capacity, protection, and utility-service questions to qualified electrical professionals. A photograph cannot confirm spare capacity or code compliance.
RECORD TO COLLECTElectrical drawings + professional assessment
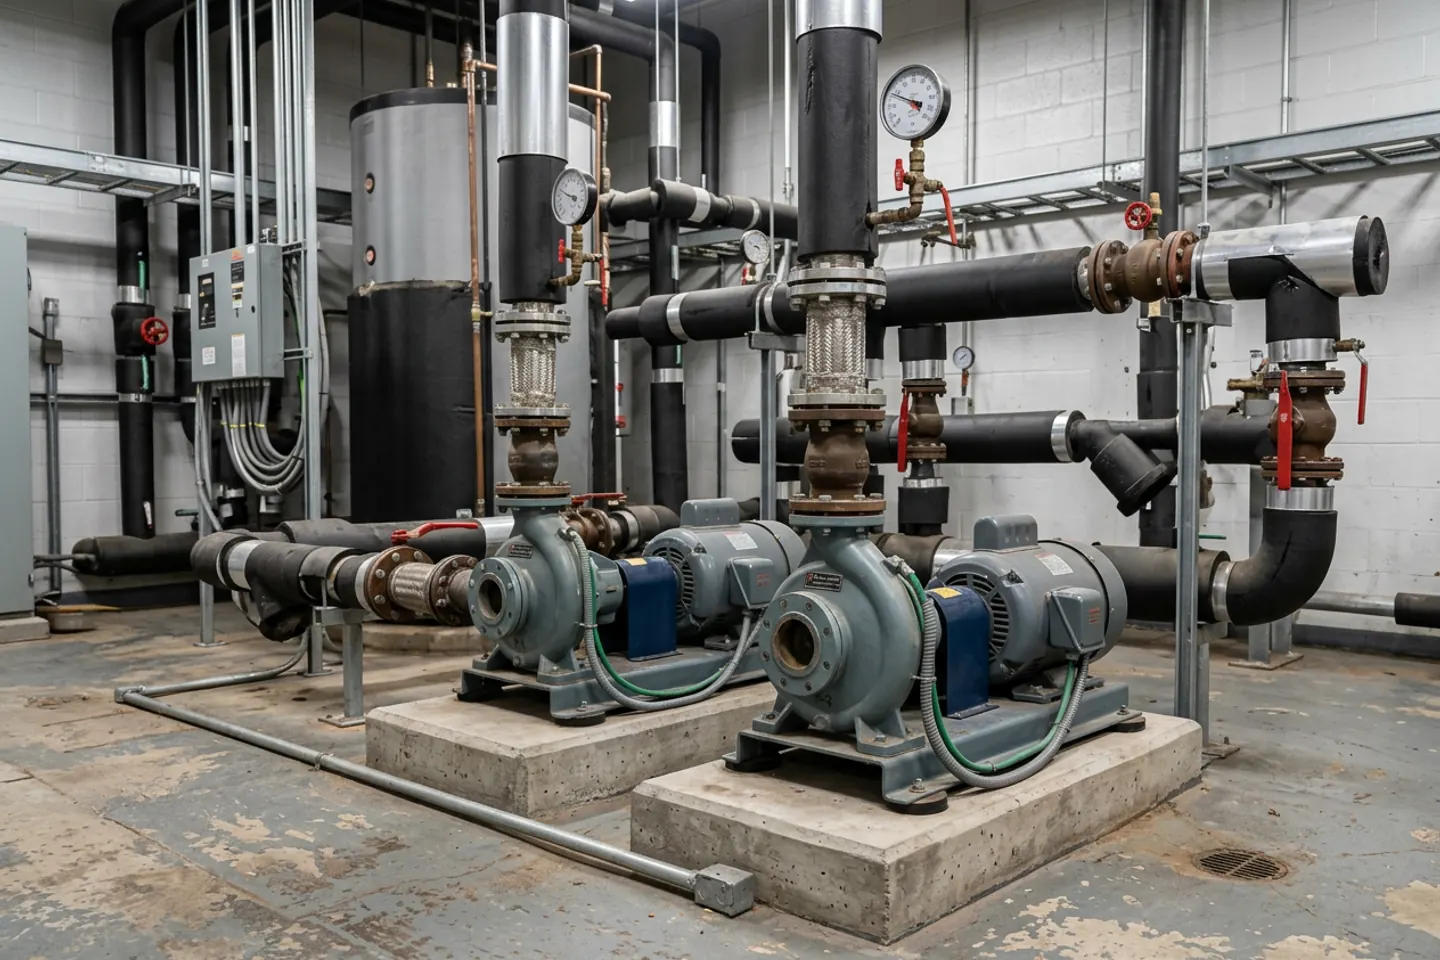
08 / Connected systems
Hydronic circulation
Keep pump, valve, and loop records connected to the equipment they support. Document operating readings and repeated faults before choosing an intervention.
RECORD TO COLLECTLoop diagram + operating readings
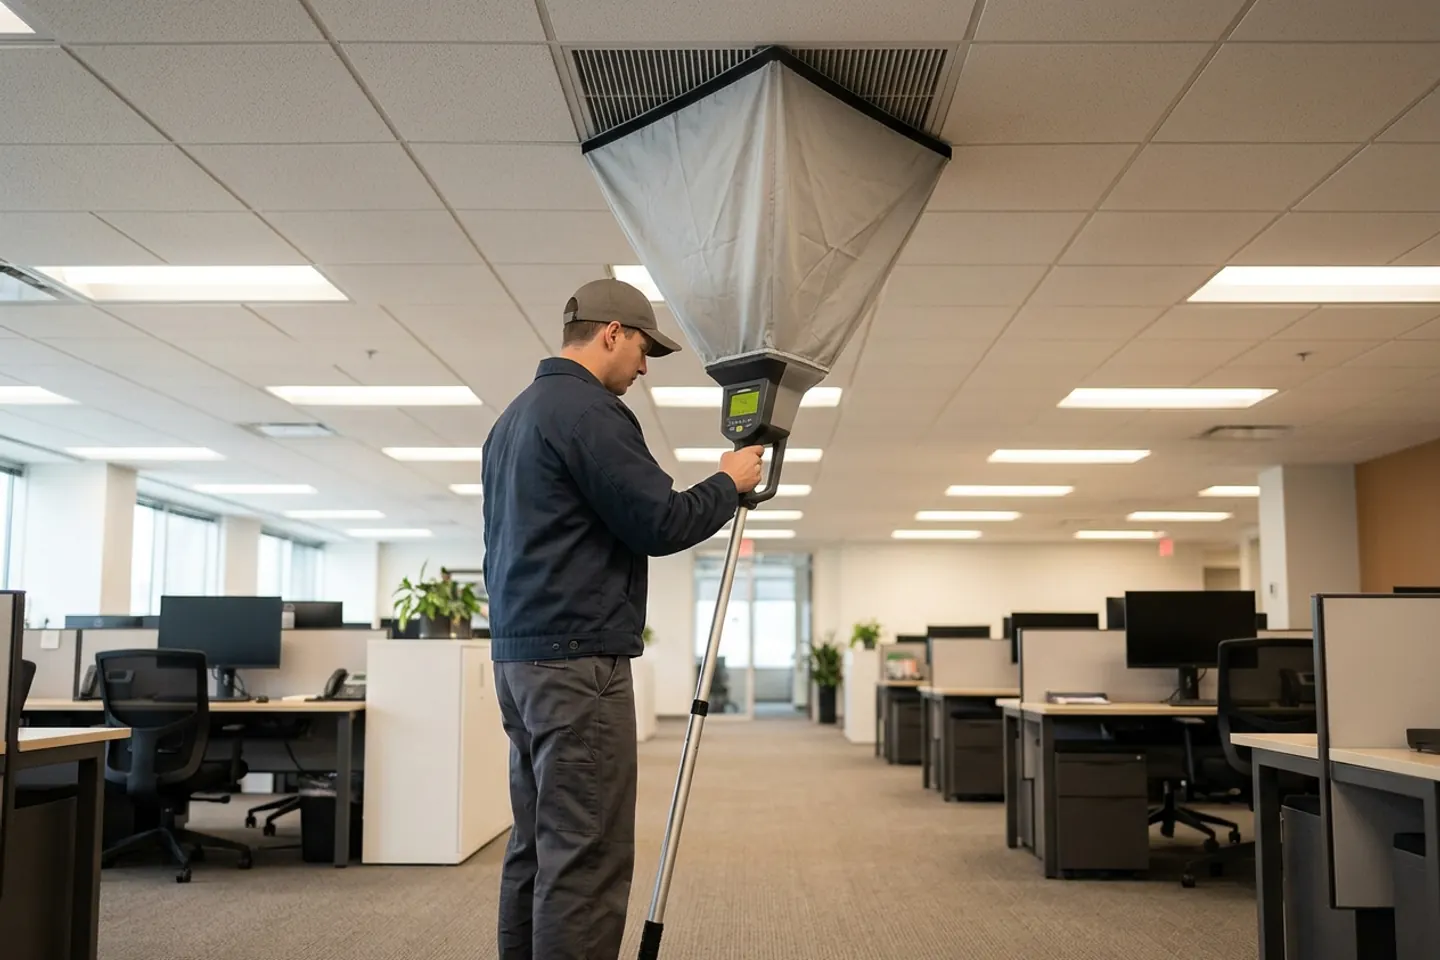
09 / Measured baseline
Field measurements
A useful test record identifies the instrument, calibration status, location, conditions, and method. Compare results with project criteria through qualified specialists.
RECORD TO COLLECTTest method + measurement report
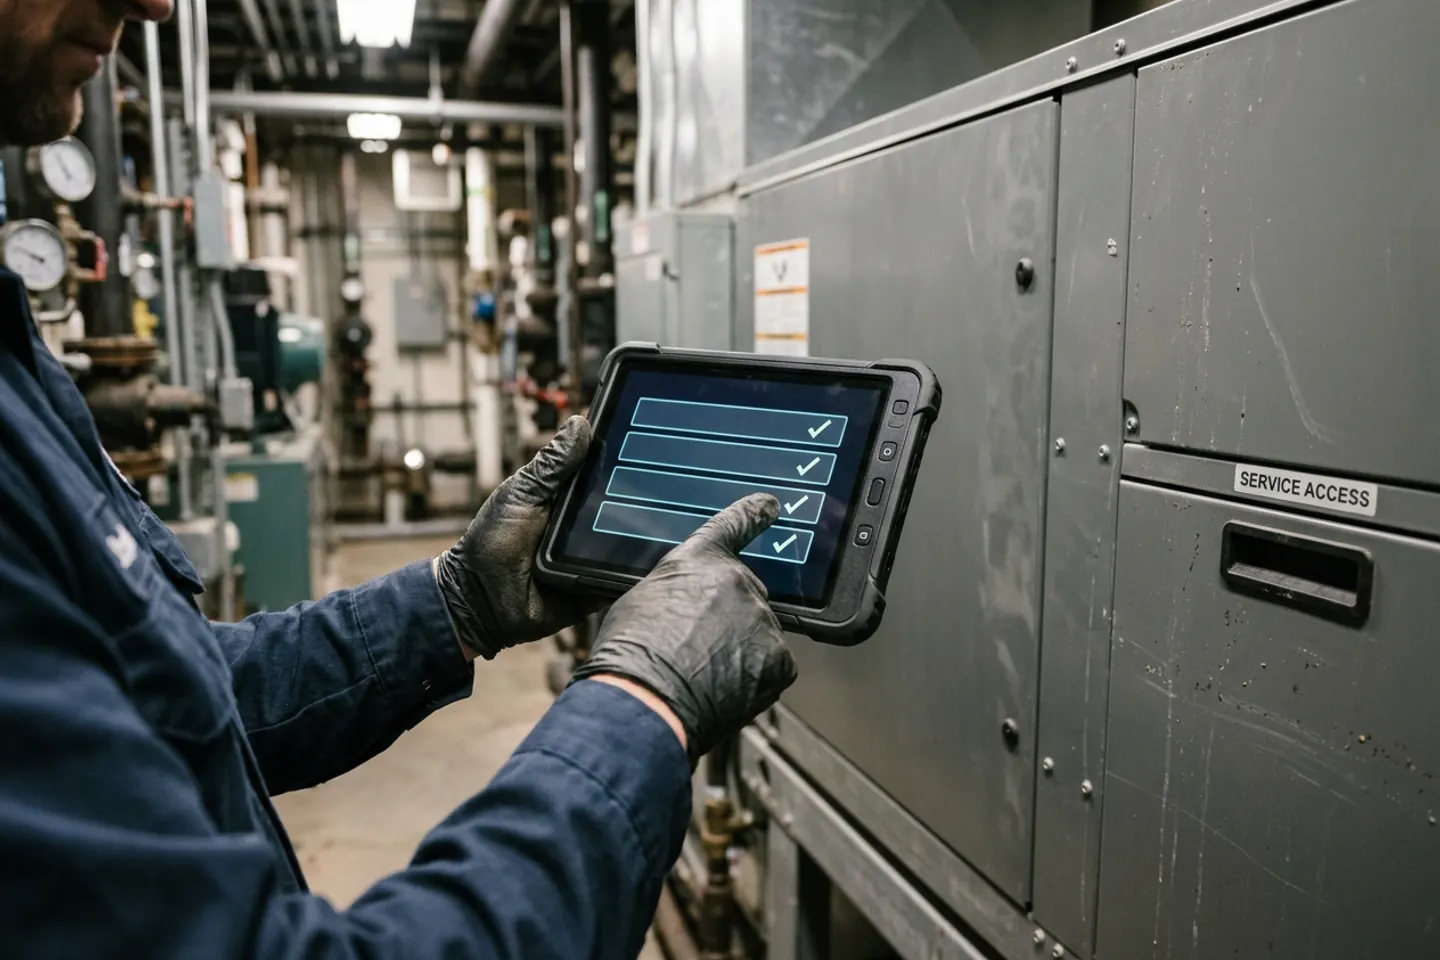
10 / Decision-ready records
Work-order closeout
Close each work order with the asset, symptom, diagnosis, action, verification, and unresolved follow-up. Keep actual site photos separate from illustrative material.
RECORD TO COLLECTCompleted work order + actual site photos
APPLY THE GUIDE IN BAKERSFIELD, CA
Define one decision for Bakersfield, CA: cooling trends versus air-quality assumptions. Record the actual property address, business impact, decision owner, and what evidence would change the next action.
Use the local sources on this page to confirm applicable requirements. Bring actual equipment photos and records to an assessment; the gallery is a conversation guide, not a site survey.
See what an assessment covers